ステップ関数・シグモイド関数
今回も引き続き、ゼロから作るDeep Learning ―Pythonで学ぶディープラーニングの理論と実装という本から引用させてもらって、ステップ関数・シグモイド関数をC言語で実装してみようと思う。
実装
まず、ステップ関数を実装してみる。ステップ関数とは、入力が0を超えたら1を出力しそれ以外は0を出力する関数である。
本では視覚的に見るためにグラフを表示していたので、今回の実装はgnuplotというフリーの描画ソフトをC言語から呼び出す形で使用してグラフを表示させていく。
gnuplotについては、以下を参考にさせていただいた。
gnuplotの基本的な使い方
gnuplotコマンド集
C言語からgnuplotを操作する
では、以下にソースを示す。
step.c
#include <stdio.h>
#include <stdlib.h>
#include <math.h>

int array_range(double, double, double, double *);
int step_function(double *, int *, int);
int plot_graph(double *, int *, int);

int main(int argc, char *argv[]) {

    double min = atof(argv[1]);
    double max = atof(argv[2]);
    double step = atof(argv[3]);
    double *array;

    int *y;
    int element = (fabs(min)+fabs(max))/step;

    array = malloc(sizeof(double) * element);
    y = malloc(sizeof(int) * element);

    array_range(min, max, step, array);

    step_function(array, y, element);

    plot_graph(array, y, element);

    free(y);
    free(array);


    return 0;
}

int array_range(double min, double max, double step, double *array) {

    int i = 0;
    double x = min;

    printf("%f %f %f\n", min, max, step);

    while (x <= max) {
    array[i] = x;
        x = x + step;
    i++;
    }

    return 0;
}

int step_function(double *x, int *y, int element) {
    int i;

    for (i=0;i<=element;i++) {
    if (x[i] > 0) {
        y[i] = 1;
        } else {
        y[i] = 0;
    }
    }

    return 0;
}

int plot_graph(double *array, int *y, int element) {

    int i;
    FILE *gp;

    gp = popen("gnuplot -persist", "w");

    fprintf(gp, "plot '-' with lines linetype 1 title \"step\"\n");

    for (i=0;i<element;i++) {
        fprintf(gp, "%f %d\n", array[i], y[i]);
    }

    fprintf(gp,"e\n");

    pclose(gp);

    return 0;
}
./step -5.0 5.0 0.1のように実行すると、-5.0から5.0までの範囲を0.1刻みで配列を作ってステップ関数の実行結果を配列として返しプロットしてグラフを表示する。結果はこんな感じになる。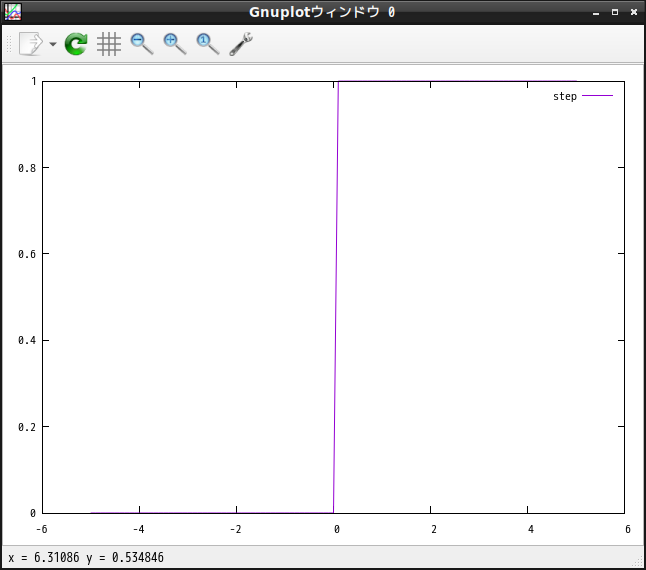
次に、シグモイド関数を実装する。シグモイド関数はニューラルネットワークでよく使われる関数だそうでステップ関数と違って滑らかな非線形関数となっている。
では、以下にソースを示す。注意点としてはシグモイド関数の実装にmath.hのexp関数を使用しているのでコンパイル時にgcc -g -o sigmoid sigmoid.c -lmのように-lmオプションをつける必要がある。
sigmoid.c
#include <stdio.h>
#include <stdlib.h>
#include <math.h>

int array_range(double, double, double, double *);
int sigmoid_function(double *, double *, double, int);
int plot_graph(double *, double *, int);

int main(int argc, char *argv[]) {

    double min = atof(argv[1]);
    double max = atof(argv[2]);
    double step = atof(argv[3]);
    double gain = atof(argv[4]);
    double *array;

    double *result;
    int element = (fabs(min)+fabs(max))/step;

    array = malloc(sizeof(double) * element);
    result = malloc(sizeof(double) * element);

    array_range(min, max, step, array);

    sigmoid_function(array, result, gain, element);

    plot_graph(array, result, element);

    free(result);
    free(array);


    return 0;
}

int array_range(double min, double max, double step, double *array) {

    int i = 0;
    double x = min;

    printf("%f %f %f\n", min, max, step);

    while (x <= max) {
    array[i] = x;
        x = x + step;
    i++;
    }

    return 0;
}

int sigmoid_function(double *array, double *result, double gain, int element) {
    int i;

    for (i=0;i<=element;i++) {
        result[i] = 1.0 / (1.0 + exp(-gain * array[i]));
        printf("%f %f\n", array[i], result[i]);
    }

    return 0;
}

int plot_graph(double *array, double *y, int element) {

    int i;
    FILE *gp;

    gp = popen("gnuplot -persist", "w");

    fprintf(gp, "plot '-' with lines linetype 1 title \"step\"\n");

    for (i=0;i<element;i++) {
        fprintf(gp, "%f %f\n", array[i], y[i]);
    }

    fprintf(gp,"e\n");

    pclose(gp);

    return 0;
}
./sigmoid -5.0 5.0 0.1 1.0のように実行すると、-5.0から5.0までの範囲を0.1刻みで配列を作ってシグモイド関数の実行結果を配列として返しプロットしてグラフを表示する。ちなみに、第4引数の1.0は標準シグモイド関数のgain値。結果はこんな感じになる。
所感
今回はステップ関数とシグモイド関数を実装してみた。それっぽいグラフが出力できてひとまず満足している。活性化関数を使用することでパーセプトロンからニューラルネットワークの世界へと進むことができるそうなので引き続きC言語で実装しつつ勉強を進めたい。